
2026 Epoxy Flooring Contractor Report: Where Garage Floor Pros Are Concentrated
In this report
How many epoxy and garage floor coating pros are there near you, and how does your state compare? To find out, we looked at the 5,983 contractors listed on EpoxyMatch in October 2026 and compared them with the latest US Census Bureau figures for population and owner-occupied homes.
The result is the first state-by-state look at where these specialists are concentrated. The short version: the Mountain West and Great Plains lead by a wide margin, Florida punches far above its size, and more than a third of listed contractors have fewer than 10 Google reviews.
Key findings
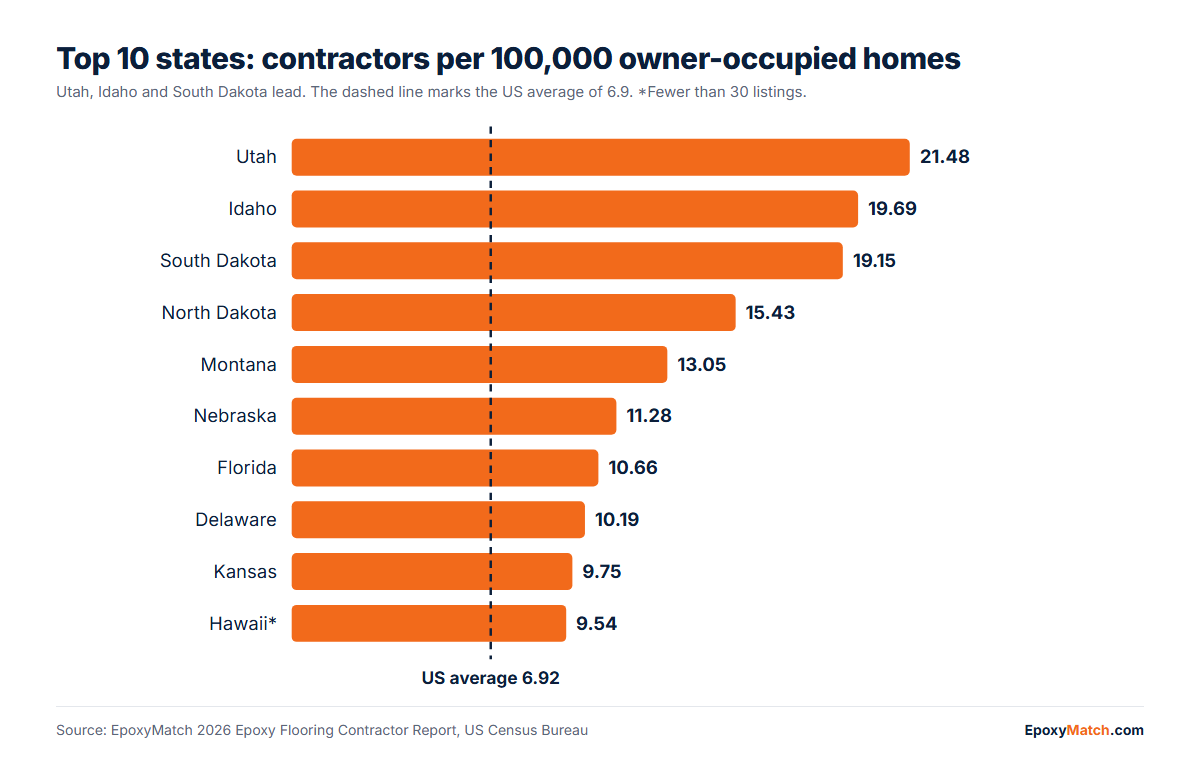
- Utah leads the country. Utah has 21.5 contractors listed on EpoxyMatch per 100,000 owner-occupied homes, 3.1 times the national rate of 6.9. Idaho (19.7) and South Dakota (19.2) follow.
- 7 of the top 10 states are in the Mountain West or Great Plains: Utah, Idaho, South Dakota, North Dakota, Montana, Nebraska and Kansas.
- Florida punches above its weight. Florida holds 11.1% of all listed contractors but only 6.9% of the US population, 1.6 times its share.
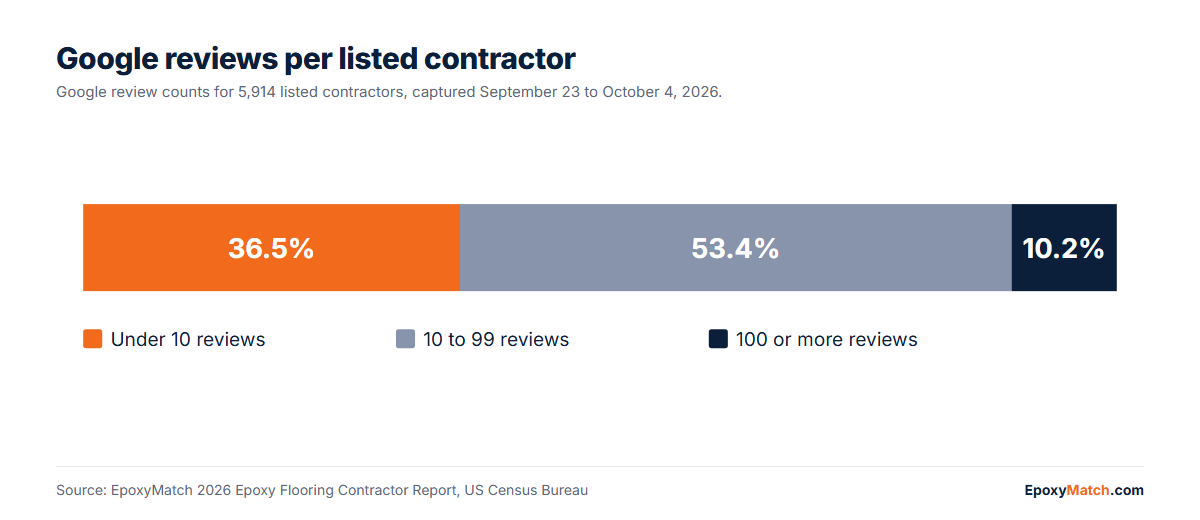
- Most pros are lightly reviewed. 36.5% of listed contractors have fewer than 10 Google reviews. The median is 15 reviews, while just 10.2% have 100 or more.
- Many pros have no storefront. About 1 in 3 listed contractors (33.8%) work as service-area businesses with no public street address on Google Maps.
The rankings: contractors per 100,000 owner-occupied homes
Owner-occupied homes are the fairest yardstick, because homeowners are the people who coat garage and basement floors.

| Rank | State | Per 100k owner-occupied homes | Per 100k residents |
|---|---|---|---|
| 1 | Utah | 21.48 | 5.00 |
| 2 | Idaho | 19.69 | 5.22 |
| 3 | South Dakota | 19.15 | 5.35 |
| 4 | North Dakota | 15.43 | 4.13 |
| 5 | Montana | 13.05 | 3.67 |
| 6 | Nebraska | 11.28 | 3.07 |
| 7 | Florida | 10.66 | 2.83 |
| 8 | Delaware | 10.19 | 2.92 |
| 9 | Kansas | 9.75 | 2.69 |
| 10 | Hawaii* | 9.54 | see full table |
| US average | 6.92 | 1.75 |
*Fewer than 30 listings, so one business moves the rate noticeably.
The full sortable table of all 50 states sits below the findings, with a CSV download.
Florida: 11% of the pros, 7% of the people
Florida has 663 contractors listed on EpoxyMatch, 11.1% of the national total, while it is home to 6.9% of Americans. Per resident, that is 1.6 times its population share. Garage and patio coatings are popular across the state’s large single-family housing stock, and the metro data shows it: Orlando, Tampa, Jacksonville, Fort Myers and Sarasota all rank among our largest contractor markets. Florida homeowners can browse every metro on our Florida contractor page.

More than a third of pros have under 10 reviews
Of the 5,914 listed contractors with Google review data, 36.5% have fewer than 10 reviews, 53.4% have between 10 and 99, and 10.2% have 100 or more. The median is 15, but the average is 43.7, because a small group of large operators have hundreds each.
For homeowners, that means review count alone will not separate good contractors from risky ones in most areas. Read recent reviews, ask for photos of finished floors, and get a written quote that names the coating system and the prep method. Our explainer on how two-part epoxy systems work makes those answers easier to follow.
About 1 in 3 work without a public address
33.8% of listed contractors are service-area businesses: they show a service area on Google Maps instead of a street address, because they work at the customer’s home. That is normal for coating crews, but it changes how you check them. Confirm the business name matches the one on the quote, ask where they are based, and check that their reviews mention jobs near you.
Big brands are a small slice
The largest name in our listings is Garage Force, with 146 locations across 38 states. Brands with 5 or more locations account for 625 of the 5,983 listings. Most of the industry, by our count, is local independent crews. Because some brand locations were added straight from brand location pages, treat this as a floor rather than a market share.
Where the most pros are: top metros
Only 95 US cities have 8 or more listed contractors with a real local presence, meaning a street address in the city or a Google Maps location within 15 miles. Those 95 cities hold 21.7% of all listings; the rest are spread across smaller towns and rural service areas.
Our first city pages cover Atlanta, Boise, Houston, San Antonio, Phoenix, Orlando, Tampa, Las Vegas, Denver and Charlotte.
| City | State | Contractors with local presence |
|---|---|---|
| Phoenix | Arizona | 37 |
| Las Vegas | Nevada | 37 |
| Charlotte | North Carolina | 33 |
| Orlando | Florida | 30 |
| Atlanta | Georgia | 27 |
| Houston | Texas | 26 |
| Nashville | Tennessee | 25 |
| Boise | Idaho | 23 |
| Indianapolis | Indiana | 23 |
| Tampa | Florida | 22 |
| Omaha | Nebraska | 22 |
| Columbus | Ohio | 22 |
| Mesa | Arizona | 21 |
| Denver | Colorado | 21 |
| Jacksonville | Florida | 21 |
| Dallas | Texas | 21 |
| San Antonio | Texas | 21 |
Top 15 metros; cities tied at 21 are all shown.
Full table: all 50 states
| Utah | 177 | 5.00 | 21.48 | 16 | 34.9% |
| Idaho | 106 | 5.22 | 19.69 | 15 | 43.8% |
| South Dakota | 50 | 5.35 | 19.15 | 10 | 50.0% |
| North Dakota | 33 | 4.13 | 15.43 | 8 | 54.5% |
| Montana | 42 | 3.67 | 13.05 | 9 | 52.4% |
| Nebraska | 62 | 3.07 | 11.28 | 18 | 30.6% |
| Florida | 663 | 2.83 | 10.66 | 21 | 26.8% |
| Delaware | 31 | 2.92 | 10.19 | 12.5 | 46.7% |
| Kansas | 80 | 2.69 | 9.75 | 18 | 30.0% |
| Hawaii* | 29 | 2.02 | 9.54 | 9.5 | 50.0% |
| Colorado | 154 | 2.56 | 9.42 | 18 | 35.9% |
| Nevada | 67 | 2.04 | 9.00 | 10 | 46.3% |
| New Hampshire | 36 | 2.54 | 8.69 | 17.5 | 25.0% |
| Arizona | 175 | 2.30 | 8.66 | 20 | 25.6% |
| Iowa | 78 | 2.41 | 8.14 | 12 | 46.8% |
| South Carolina | 130 | 2.33 | 8.09 | 15 | 36.7% |
| Minnesota | 130 | 2.23 | 7.68 | 16 | 33.1% |
| Wisconsin | 131 | 2.19 | 7.60 | 24 | 26.0% |
| Michigan | 228 | 2.25 | 7.51 | 19.5 | 36.0% |
| Tennessee | 147 | 2.01 | 7.51 | 15 | 36.3% |
| Rhode Island* | 21 | 1.88 | 7.38 | 8 | 57.1% |
| Arkansas | 61 | 1.96 | 7.29 | 7 | 52.5% |
| Connecticut | 69 | 1.87 | 7.11 | 12.5 | 42.6% |
| Oregon | 78 | 1.83 | 7.09 | 14 | 39.7% |
| Georgia | 196 | 1.73 | 7.00 | 17 | 33.3% |
| North Carolina | 208 | 1.86 | 6.92 | 18 | 32.0% |
| Indiana | 134 | 1.92 | 6.83 | 24.5 | 28.0% |
| Ohio | 218 | 1.83 | 6.50 | 17 | 30.7% |
| Missouri | 114 | 1.82 | 6.49 | 13 | 41.2% |
| Texas | 437 | 1.38 | 6.12 | 13 | 40.1% |
| Washington | 116 | 1.45 | 5.82 | 11 | 43.5% |
| New Mexico | 35 | 1.65 | 5.75 | 20 | 28.6% |
| Massachusetts | 101 | 1.41 | 5.72 | 12 | 44.0% |
| Illinois | 197 | 1.55 | 5.71 | 17 | 30.8% |
| Alaska* | 10 | 1.36 | 5.49 | 6 | 70.0% |
| California | 420 | 1.07 | 5.45 | 10 | 49.0% |
| New Jersey | 121 | 1.27 | 5.34 | 21.5 | 27.5% |
| Oklahoma | 54 | 1.31 | 5.13 | 10 | 50.0% |
| Alabama | 74 | 1.42 | 5.06 | 18 | 26.8% |
| Wyoming* | 9 | 1.53 | 4.90 | 6 | 77.8% |
| Kentucky | 62 | 1.35 | 4.88 | 20 | 36.1% |
| Louisiana | 61 | 1.32 | 4.85 | 12 | 49.2% |
| Virginia | 112 | 1.26 | 4.84 | 24.5 | 31.8% |
| Vermont* | 10 | 1.55 | 4.78 | 6 | 70.0% |
| Pennsylvania | 176 | 1.35 | 4.74 | 18 | 33.0% |
| New York | 199 | 0.99 | 4.68 | 15.5 | 35.9% |
| Maryland | 75 | 1.20 | 4.61 | 15 | 40.0% |
| Mississippi | 32 | 1.08 | 3.86 | 5 | 68.8% |
| Maine* | 17 | 1.20 | 3.77 | 10 | 47.1% |
| West Virginia* | 17 | 0.96 | 3.04 | 7 | 52.9% |
*Fewer than 30 listings, so one business moves the rate noticeably.
What this means if you are hiring
In the top-ranked states, homeowners have plenty of choice and can afford to be picky. In states lower on the list, it may take more calls to find an available crew, so start early, especially before spring. Wherever you live, compare at least three written quotes, and check our garage floor coating price guide so you know what a fair number looks like. If you are still deciding whether to hire at all, our DIY vs pro comparison walks through the trade-offs, or you can browse epoxy flooring contractors by state.
Methodology
- Contractor data: the 5,983 published contractor listings on EpoxyMatch as of October 14, 2026. Listings were collected from Google Maps searches across all 50 states and from brand location pages, then filtered to remove flooring stores, suppliers, unrelated trades, closed businesses, duplicates and lead-generation sites.
- Population: US Census Bureau state population estimates, Vintage 2025.
- Owner-occupied homes: US Census Bureau American Community Survey 2024 1-year estimates, table B25003.
- Reviews: Google review counts captured between September 23 and October 4, 2026, available for 5,914 listings.
- Local presence: a listing counts toward a city if it has a public street address in that city, or a Google Maps location within 15 miles of the city centre.
- Limitations: these figures describe contractors listed on EpoxyMatch, not every contractor in the US. Our coverage depends on how many cities we searched in each state and on Google Maps result limits in large metros, so big states such as California, New York and Texas are likely undercounted relative to small ones. States with fewer than 30 listings are marked with an asterisk.
Use this data
You are free to use and share these findings, charts and the CSV with credit. Please link to this page: https://epoxymatch.com/reports/epoxy-contractors-by-state-2026/